Part 1: The Evidence – How They Dismantled the Australian Fair Go
By Sue Barrett

This is Part 1 of a three-part investigation into who’s responsible for Australia’s declining living standards. Over the next three days, we’ll follow the money, name the architects, and map the path forward. If you’re angry about the system – and you should be – let’s make sure that anger is pointed in the right direction.
The Symptom: 1 in 4 Gen X Men Now Support One Nation
Something remarkable is happening in Australian politics, and it’s not what the pundits are saying.
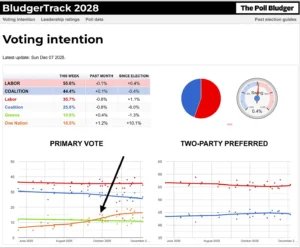
Since late August 2025, after immigration rallies sparked by parts of the Coalition, a significant chunk of the electorate has shifted. According to research by Kos Samaras, 1 in 4 Gen X men who voted for Peter Dutton on May 3 are now supporting One Nation.
That’s not a protest vote. That’s a market. One Nation now polls between 14-17% nationally. Among men over 55, it’s approaching 1 in 4.
These men didn’t wake up radicalised. They were recruited. Targeted. Sold a product.
When people latch onto immigration as a top-tier issue, Samaras explains, it’s rarely about immigration itself. It’s because deeper anxieties need an outlet: “loss of status, loss of control, rapid change in their communities, and an economy that feels rigged against them.”
Here’s the critical questions: Who benefits when working Australians fight each other instead of looking up? And who’s profiting from keeping them angry at the wrong targets?
The voters gravitating to One Nation aren’t wrong about one thing – the system is rigged. But the architects of that rigging are counting on you getting the target wrong. They’re counting on your anger flowing downward – toward migrants, toward women who “took your jobs,” toward anyone who looks or sounds different – rather than upward toward the people who actually have the power to make or break your economic security.
This isn’t a lecture. This is forensic accounting.
Let’s follow the money and see who actually pulled the rug out from under working Australians. Because once you see the pattern, it becomes impossible to unsee.
SECTION 1: The System That Was Rigged – With Receipts
How They Dismantled the Australian “Fair Go”
If you feel like you’re working harder but getting less, you’re not imagining it. The data is stark and undeniable. Here’s what happened while you were told to blame migrants and women.
1. The Wage Theft: When Your Work Stopped Paying
Let’s start with the foundation: the relationship between how hard Australians work and what they get paid.
For most of modern history, when workers became more productive – when they produced more output per hour – their wages rose accordingly. This wasn’t charity. It was the deal. You work smarter, produce more, you get paid more. The economic pie grows; everyone’s slice grows.
That deal is broken.
Between 1994 and 2023, labour productivity and real wages in Australia diverged by approximately 0.54 percentage points per year. That might sound small, but compounded over 29 years, it means your wages are substantially lower than they should be based on the value you’re creating.
Here’s what that looks like in plain English: In 2022-23, labour productivity fell by 3.7%, but real wages also fell by 3.7%. But here’s the kicker – when productivity was growing in earlier years, wages didn’t keep pace.
The gains from your increased productivity went somewhere else.
For context: Between March 2012 and 2022, productivity across the economy increased 11%. In that same period, real wages per hour fell by 0.2%. Read that again. You became 11% more productive. Your hourly pay in real terms went down.
Let’s use a concrete example. Imagine two workers in 1995, doing identical jobs. One works for a company where the gains from productivity are shared. The other doesn’t. By 2023, even though they’re doing the same work at the same productivity level, the first worker is earning roughly 8% more. That’s the “wage decoupling” in action – and that 8% difference can mean the difference between saving for a home and treading water.
The psychological mechanism at play here: This is called displacement of responsibility.
When the system is complex, when wages are determined by enterprise agreements and award systems and “market forces,” it becomes easy for those extracting the value to point elsewhere. “It’s not us – it’s globalisation, it’s technology, it’s market conditions.” Meanwhile, the gap between what you produce and what you’re paid widens steadily, and the difference flows upward.
2. The Casualisation Con: Turning Jobs Into Gigs
Here’s what they did to employment while telling you to be “flexible”:
From 1976 to 2016, union membership fell from 51% to 14%. That’s not an accident – that’s a systematic campaign. With union power broken, employers could redesign work itself.
Today, 55% of workers aged 15-24 are casual employees, compared to just 19% of workers aged 25-44. Young people entering the workforce now aren’t just “starting out on casual work” – they’re being locked into a system where casual and insecure work is the new normal.
The data also shows only 6% of casual employees are union members, compared to 18% of permanent employees. Why? Because casual work is deliberately designed to be difficult to organise. You’re isolated, you’re replaceable, and you’re one shift cut away from losing your income.
What does casualisation cost you?
- No sick leave (if you’re sick, you don’t get paid – simple as that)
- No annual leave (no paid holidays, ever)
- No job security (your hours can be cut or eliminated any week
- No bargaining power (complain and you’re simply not rostered next week)
This wasn’t inevitable. This was designed. And the people who designed it are the same ones now telling you immigrants are the problem.
The psychological mechanism: This is advantageous comparison.
They compare your situation to “even worse” scenarios. “At least you have some work.” “At least you’re not unemployed.” Meanwhile, what you should be comparing it to is the secure, permanent work with leave entitlements that was standard for previous generations.
3. Penalty Rates Gutted: Weekend Work Stops Paying Extra
Remember when working weekends or nights meant significantly higher pay? That was the trade-off: you sacrifice your personal time, you get compensated fairly.
That’s been systematically dismantled. Various industries saw their penalty rates slashed after intensive lobbying from business groups. The retail and hospitality sectors – which disproportionately employ younger workers – were hit hardest.
Who lobbied for this? Let’s name them:
- Australian Retailers Association
- Restaurant & Catering Industry Association
- Australian Hotels Association
Their argument? “If we pay workers properly on weekends, businesses will close.”
The reality? Those businesses are still operating. But workers are being paid less for the same unsociable hours. The savings went to owners and shareholders, not to consumers through lower prices, and definitely not back to workers.
The psychological mechanism: Moral justification.
They frame paying workers fairly as an existential threat to business survival. “It’s us or them.” “If we pay penalty rates, we’ll have to close and everyone loses jobs.” It’s a manufactured false choice that obscures the real question: Why can’t a business model survive while paying workers fairly for unsociable hours?
4. Union-Busting as Strategy: Destroying Your Bargaining Power
The decline in union membership isn’t organic – it’s the result of a sustained, coordinated attack.
The numbers tell the story:
- 1992: 40% of Australian workers were union members
- 2024: 13% of Australian workers are union members
- Private sector 2024: Just 7.9% union membership (down from 8.3% in 2022)
Compare that to specific industries:
- Education and training: 27% (still the highest, but down from 30.1% in 2022)
- Electricity, gas, water and waste services: 20.2% (down from 21.6%)
- Mining: 9.5% (down from 10.2%)
What’s particularly telling: the biggest membership losses were in unions representing manufacturing and industrial workers:
- Australian Manufacturing Workers’ Union: Down 52% (lost 73,536 members)
- Australian Workers’ Union: Down 42.6% (lost 51,751 members)
- Community and Public Sector Union: Down 27% (lost 45,862 members)
This wasn’t just about workers “losing interest” in unions. Laws were changed to make organising harder. Employers hired “union avoidance” consultants. Workplaces were restructured to make collective bargaining nearly impossible.
When you can’t collectively bargain, you have to accept what’s offered. When you have to accept what’s offered, wages stagnate. It’s not complicated.
Young workers aged 15-24 have a union membership rate of just 6% – this isn’t because they don’t want collective representation, it’s because they’re being funnelled into casual and gig work specifically designed to be impossible to organise.
The psychological mechanism: Dehumanisation and euphemistic labelling.
Workers organising collectively become “union thugs,” “militants,” or “unreasonable.” Their demands for fair pay become “uncompetitive,” “unrealistic,” or “economically irresponsible.” Collective action becomes “industrial action” (making it sound like warfare rather than workers asserting basic rights). The language shifts so that the act of workers standing together becomes threatening rather than necessary.
5. Housing Financialised: When Homes Became Investment Products
This might be the starkest example of the rigged system.
Over the past 27 years:
- Average housing costs increased: 483%
- Average wages rose: 127.5%
Let that sink in. Housing went up nearly 4 times as much as wages. This isn’t a natural market function – this is the result of policy decisions that deliberately turned housing from shelter into an asset class for wealth accumulation.
In March 2002, the average house in Sydney cost 8.3 times the average annual full-time wage. Expensive, yes. But achievable with planning.
In June 2024, that ratio is now 14.4 times the average annual full-time wage.
In dollar terms: The average dwelling price in Sydney is $1.45 million. If it had grown at the same pace as wages (that 8.3x ratio), it would be $835,000. That means people in Sydney need to find an extra $615,000 compared to what was required just 22 years ago.
It’s even more dramatic in places like Hobart:
2002: 2.8 times average annual earnings
2024: 7.6 times average annual earnings
The average house in Hobart is $676,000. If the ratio had stayed at 2.8x, it would be $249,000.
For renters, it’s equally brutal:
Over the past 10 years:
- House rents increased: 59.8% (from $540 to $858/week on average)
- Unit rents increased: 52.4% (from $420 to $639/week)
- Wage growth: 28.9%
In Hobart specifically, rent increased 75.7% (from $324 to $569/week) while wages crept up less than 29%.
Here’s what “rental stress” means: 70% of renting households now spend more than 30% of their income on rent. Many spend 40-50%. That’s not a housing crisis – that’s a housing catastrophe.
As of August 2024, first-home buyers can now afford just 12% of homes nationally, down from nearly one-third only five years ago.
Who benefited from this?
- Property investors who own multiple properties (negative gearing allowed them to offset losses against other income)
- People who already owned property (capital gains taxed at half the rate of income from work)
- Banks (larger mortgages mean more interest payments over longer periods)
- Real estate industry (higher prices mean higher commissions)
Who got crushed?
- First-home buyers
- Renters
- Young people
- Single-income families
- Anyone who didn’t already own property
The psychological mechanism: Diffusion of responsibility.
“The market” set these prices. “Supply and demand.” No one person or entity is to blame – it’s just how things work. Except it’s not. Policy decisions on negative gearing, capital gains tax discounts, foreign investment rules, social housing funding, and zoning created this market. People made choices. Those choices benefited existing property owners at the expense of those trying to enter the market.
The Pattern
Do you see it yet?
Every single one of these changes has one thing in common:
They transferred wealth and security from workers to owners.
- Productivity gains went to shareholders, not workers
- Secure jobs became casual work with no entitlements
- Penalty rates that compensated for unsociable hours disappeared
- Union power that could have fought back was systematically destroyed
- Housing that was affordable became an investment vehicle for the already wealthy
And the psychological mechanisms used to justify this wealth extraction? They’re textbook:
- Moral justification: “We have to stay competitive globally”
- Euphemistic labelling: “Workplace flexibility” (casualisation), “Housing investment” (speculation)
- Advantageous comparison: “At least you have a job”
- Displacement of responsibility: “It’s the market, not us”
- Diffusion of responsibility: “Everyone’s doing it”
- Dehumanisation: Workers become “costs,” “labour units,” “human resources”
And these are just the most visible mechanisms.
The same wealth extraction logic drives the labour hire boom (same work, less pay, no security), TAFE defunding (making it harder to retrain or upskill), the shift from industry-wide awards to fragmented enterprise bargaining (divide and conquer), privatisation of public services (secure jobs become casualised), the gig economy (workers reclassified as “contractors” to avoid all obligations), and deliberate award complexity (making wage theft easier to hide). Each change, taken alone, can be justified with the same moral disengagement mechanisms. Together, they form a system designed to transfer wealth upward while workers are told it’s “modernisation” or “efficiency.”
You’re Being Sold a Distraction
Those Gen X men flooding to One Nation? They didn’t radicalise on their own. They were recruited. Targeted. Sold a product called “cultural grievance” when their real problem is economic extraction.
The people who gutted penalty rates, destroyed unions, and turned housing into speculation are counting on you fighting migrants and women – people with zero lobbying power – instead of looking up at boardrooms where CEOs make 50x your wage.
This is moral disengagement at industrial scale. And it only works if you don’t see the pattern.
This is the system that’s rigged against you.
Tomorrow, in Part 2, we’ll look at who’s getting rich while you’re being told to blame migrants and women. We’ll name names, show the money, and reveal exactly how corporate lobbying created this wealth extraction machine.
What You Can Do Right Now
Don’t wait for Part 2. Here are actions you can take today:
1. Check Your Own Workplace
- Are you being paid correctly for all hours worked?
- Are you owed penalties, overtime, or leave entitlements?
- Document everything. Wage theft is rampant because it’s barely punished.
- Resources: Fair Work Ombudsman (fairwork.gov.au), Wage calculator tools
2. Know Your Rights
- Understand your award or enterprise agreement
- Join your union or at least understand what collective bargaining could offer
- Even if you’re casual, you have rights – know them
3. Talk About Money
- Break the taboo of discussing wages with colleagues
- Corporate culture wants you isolated – wage transparency benefits workers
- Compare pay rates, push for equity
4. Vote With Full Information
- When politicians talk about “tax cuts,” ask: cuts for workers or cuts for corporations?
- When they promise “workplace flexibility,” ask: who benefits from casualisation?
- When they talk about “immigration,” ask: what are they not talking about? (Hint: wealth extraction)
5. Support Investigative Journalism
- Outlets like Michael West Media, Crikey, The Klaxon, The Saturday Paper do this forensic work
- Subscribe, share, support – corporate media won’t do this analysis
Having the Conversation: A Guide
The reality: The people who most need to read this probably won’t. They’re getting their information from sources that deliberately point their anger downward, not upward.
So how do you talk to someone who’s convinced immigrants or women are the problem? Here are some approaches:
Start With Agreement
Don’t argue. Find common ground first.
Instead of: “You’re wrong about immigration!”
Try: “You’re absolutely right that the system is rigged. I’ve been looking at the data and it’s worse than I thought. But I found something interesting about who’s actually rigging it…”
Use Questions, Not Statements
Questions create space for people to think. Statements trigger defences.
Conversation Starters:
- “If immigration is the problem, why did wages fall even when immigration was restricted during COVID?”
- “Who do you think has more power to set your wages – a migrant working two jobs, or the CEO making 50 times what you make?”
- “Do you remember when weekend penalty rates were higher? Where do you think that money went when they cut penalty rates?”
- “If women entering the workforce was bad for the economy, why are countries with higher gender equality actually richer overall?”
- “Who benefits when we’re fighting each other instead of asking why productivity went up 11% but wages went down?”
Share Your Own Experience
Personal stories work better than statistics (though we need both).
Try: “I looked up my industry’s productivity versus wage growth. We’re producing way more per hour but getting paid less. That money’s going somewhere – and it’s not to immigrants or women, because they’re workers too. So where is it going?”
Redirect to Specific, Named Culprits
Instead of vague “elites,” be specific.
Try: “Did you know the Australian Retailers Association lobbied specifically to cut penalty rates? They’ve got names, addresses, annual reports. They’re not hiding. Meanwhile we’re being told to blame people with no lobbying power at all.”
Validate the Anger, Redirect the Target
Try: “You should be angry. The question is: angry at people with no power, or angry at people who literally lobbied to change the laws so they could pay you less?”
Plant Seeds, Don’t Expect Instant Conversion
You won’t change minds in one conversation. Aim to create doubt, curiosity, questions.
Try: “Look, I used to think [X] too. But then I saw [specific data point]. Made me wonder who actually benefits from us fighting over immigration instead of asking about wage theft. Worth looking into.”
Share This Article
Try: “Hey, I read this breakdown of wage data versus productivity. Pretty eye-opening about where the money actually went. Would be interested to hear what you think. [link]”
You know what to do.
Onward we press
Tomorrow: Part 2 – The Architects: Who Got Rich and How They Did It
We’ll follow the money to CEO pay packets, tax havens, and lobbying firms. We’ll use the Democracy Watch framework to show exactly how moral disengagement enabled the biggest wealth transfer in Australian history. And we’ll name names.
This is Part 1 of 3. Share this with someone who’s angry about the system but pointing their anger in the wrong direction. Sometimes all it takes is seeing the data to recognise who really pulled the rug.
Sources & References
All claims in this article are based on publicly available data:
Wage and Productivity Data:
- Productivity Commission (2024), “Annual Productivity Bulletin 2024”
- Productivity Commission (2023), “Productivity Growth and Wages: A Forensic Look”
- Reserve Bank of Australia (2024), “Developments in Wages Growth Across Pay-setting Methods”
- Australian Bureau of Statistics, Wage Price Index, various years
- Australia Institute (2022), “Ten Years of Productivity Growth, But No Increase in Real Wages”
Union Membership Data:
- Australian Bureau of Statistics (2024), “Trade Union Membership, August 2024”
- Australian Bureau of Statistics (2024), “Characteristics of Employment, Australia”
- Parliamentary Library (2018), “Trends in Union Membership in Australia”
- Reserve Bank of Australia (2019), “Is Declining Union Membership Contributing to Low Wages Growth?”
Housing Data:
- Australian Institute of Health and Welfare (2024), “Housing Affordability”
- National Housing Supply and Affordability Council (2025), “State of the Housing System Report 2025”
- CoreLogic (2025), Rental and Price Index Data
- Australia Institute (2024), “Housing Affordability is on a Very Dangerous Path”
- Demographia (2025), “International Housing Affordability Report”
Employment Data:
- Australian Bureau of Statistics, Labour Force Survey, various years
- Fair Work Commission (2024), “Information Note: Labour Productivity”
Political Analysis:
- Kos Samaras, RedBridge Group polling and analysis (Twitter/X: @KosSamaras)
Moral Disengagement Framework:
- Based on Albert Bandura’s moral disengagement theory, applied through Democracy Watch AU methodology
This article was originally published on Sue Barrett
Keep Independent Journalism Alive – Support The AIMN
Dear Reader,
Since 2013, The Australian Independent Media Network has been a fearless voice for truth, giving public interest journalists a platform to hold power to account. From expert analysis on national and global events to uncovering issues that matter to you, we’re here because of your support.
Running an independent site isn’t cheap, and rising costs mean we need you now more than ever. Your donation – big or small – keeps our servers humming, our writers digging, and our stories free for all.
Join our community of truth-seekers. Donate via PayPal or credit card via the button below, or bank transfer [BSB: 062500; A/c no: 10495969] and help us keep shining a light.
With gratitude, The AIMN Team

“Who really pulled the rug?” The answer is simple we did.
Political duopolies aren’t about governance of the people, they are about power, so we have a continual fight between the LNP and Labor.
All the time the electorate votes into power Tweedle Dee or Tweedle Dum things won’t improve, what is required is a coalition of minor parties and Independents.
The Labor, LNP duopoly has failed us.
Not sure of a clear correlation between GenX and ON without a breakdown of postcodes/electorates, education and ethnicity; guess boomers and silent gens who support ON also?
Even with 14 – 17% of the vote across the country in House of Representatives electorates, One Nation has no hope of forming government. It is very unlikely to win any Lower House seats. The constant suggestions that One Nation has any chance of forming government is nonsense
Lyndal, thank you for stating the facts on the “surge’ to One Nation.
All One Nation has done in the Senate is vote with the coalition and that’s what Barnaby will do, when they remember to vote or even turn-up.